We strongly recommend reading this example to help you contextualize the report data, especially if it's your first benchmarking report.
Sonarians love data—probably a lot more than a lot of people! We know that at least 25% of people like cats, so we want to provide an example of how we measured data for this report to help you contextualize how you’ll see results presented by … examining cats, of course.
Example
Let’s say you run a boarding house for cats, and you have the honor of hosting a maximum of 25 cats at a time. However, on any given day, you may not have any pet parents bring in their cat.
It’s hard to run a cat hotel when you don’t know whether you'll have 0 cats per day or 25! So you decide to analyze the last seven days to determine how many cats you hosted per day. These daily stats are: 0, 13, 14, 18, 21, 22, 25. With this historical data in hand, you can calculate a few statistics for this time period.
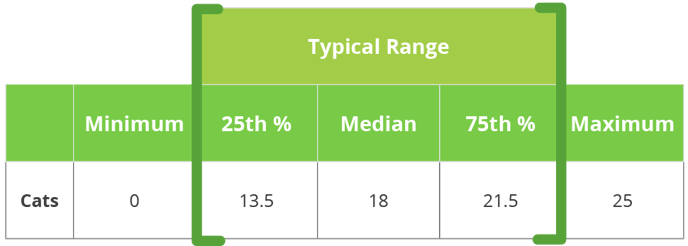
- Minimum number of cats hosted: 0
- 25th percentile: 13.5
- 50th percentile (median): 18
- 75th percentile: 21.5
- Maximum number of cats hosted: 25
Now you can use this data to make some observations. Over the past week, 50% of the week you hosted fewer than 18 cats and 50% of the week you hosted more than 18 cats. The minimum and maximum determines your total range (0 to 25), but the one day you hosted zero cats is an outlier, as you took that day off.
You wonder what a typical range of cats you might expect in a week, but your day off hosting zero cats skews your data. Focusing on how much variation around the median (18) helps with that—you can review the range of your 25th to 75th percentiles as typical for your daily volume of cats and expect between 14 and 22 cats per day.
How comfortable can you be in that daily estimate? There’s one last calculation you can use to measure how consistent your data is and determine whether it’s closer to the 50th percentile or closer to the minimum and maximum values of your range. You calculate that your consistency (or variation) over the last week in the number of cats you’ve hosted is fairly low, so you can feel more confident in your daily estimate of 14 to 22 cats.
Don’t Forget
Come back to this example if you need some help digesting the benchmarks. And remember these key points.
- Your goal in reading this report is to be able to benchmark your campus’s online conversation. Since campuses vary widely in size, resources, and a bunch more factors, our data gives you statistics to help you see a typical range (between the 25th and 75th percentiles, or the typical range) you can use to evaluate your campus.
- We give you both those ranges as percentages as well as the raw numbers of mentions (a mention is basically just that … any documented mention of one of the institutions from our data’s sample set, like a tweet about them or a mention of them in a forum).